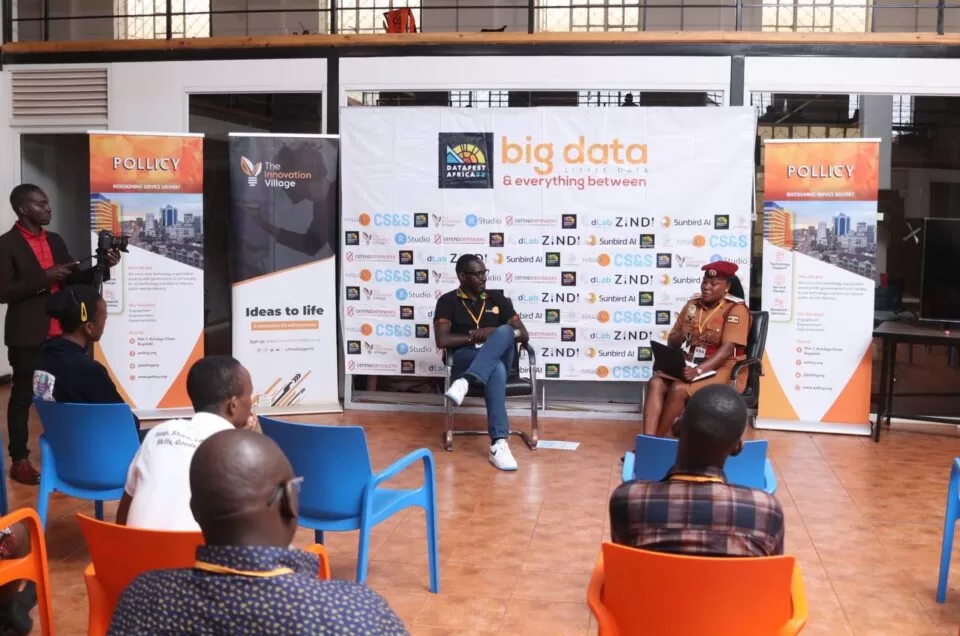


In today’s data-driven world, the DataFest VizQuest competition, a thrilling Data Visualisation competition, brings together individuals, teams, and organisations to showcase their talent in data visualisation.
As a collaborative initiative by Pollicy, AirQo, Sunbird AI, Evidence and Methods Lab and Africa Data Hub, the 2023 Datafest Africa VizQuest aims to bridge the gender data gap and drive social impact through the power of visual storytelling. Participants will utilise open data sources and various visualisation techniques to create informative and engaging visualisations that address gender-related issues. From exploring the gender pay gap to highlighting women’s representation in leadership, this data visualisation competition challenges participants to unlock the potential of data visualisation in shaping policies and promoting equality. Join us in this exciting journey of turning data into powerful stories that make a difference.
The DataFest VizQuest data visualisation competition welcomes individuals, teams, and organizations who have a passion for data visualization and a drive to make a difference. Whether you are a data enthusiast, a creative designer, or a policy advocate, this competition offers an inclusive platform for participants to showcase their skills and contribute to meaningful change. Participants can be based in Uganda or have the ability to travel to Kampala for the in-person event. Join us in this collaborative journey to harness the power of data visualization for social impact and gender equality.


The DataFest VizQuest competition is centred around addressing gender-related issues through data visualisation. Participants are encouraged to explore a range of themes that play a crucial role in achieving gender equality. These themes include, but are not limited to:
Analysing and visualising disparities in wages and income between genders.
Shedding light on different forms of violence against women and promoting awareness for prevention and support.
Examining and representing the level of female representation in decision-making positions across various sectors.
Visualising gaps in education and access to opportunities for women and girls.
Exploring gender-related health disparities and promoting well-being among women.
Participants are encouraged to choose a theme that aligns with their interests and create data visualisations that provide insights, promote understanding, and inspire positive change.
Evaluation
The competition will be divided into three phases:
1. Submission Phase:
Participants will be required to identify/source for datasets that they will base their visualisations ideas on and submit via an online platform. The submission should include a brief description of the visualisation and the techniques employed.
2. Judging Phase:
This is the final phase where teams will present their data visualisation in front of a panel and they are going to be judged. Participants will be judged based on criteria such as creativity, feasibility, impact, technical proficiency, and presentation skills.
The main categories or criteria for judgement are as below:
3. Awards and Recognition:
Winners of the competition will be announced, and awards and recognition will be given to the 3 overall best top-performing visualisations. The winning visualisations will be showcased during the main DataFest Africa event in Nairobi in an exhibition and featured on the Pollicy / Datafest Africa websites.
Teams and Collaboration
After selection, Teams of 2 to 5 members will begin working on their project. We encourage mixed-gender teams and teams with different disciplines.
You may participate in this competition as an individual or in a team of up to four or five people. When creating a team, the team must have a total submission count less than or equal to the number of its team members. Prizes are transferred only to the individual players or to the team leader.
Multiple accounts per user are not permitted, and neither is collaboration or membership across multiple teams. Individuals and their submissions originating from multiple accounts will be immediately disqualified from the platform.
Original concepts must not be shared privately outside of the respective team.
Once a submission is made individual members cannot leave the team. No additional members may be added to teams within the final 3 days of the competition.
Datasets
The competition is open to individuals, teams, and organisations who have a passion for data visualisation and a desire to address gender-related issues. Participants can be based in Uganda or have the ability to travel to Kampala for the in-person event.
The competition focuses on themes related to gender equality, including the Gender Pay Gap, Women’s Representation in Leadership, Education and Access to Opportunities, Violence Against Women, and Health and Well-being. Participants are encouraged to choose a theme that aligns with their interests and create data visualisations that shed light on these important topics.
Participants are required to use open data sources to create their visualisations. They have the freedom to collect their own data that aligns with the specified themes or use the provided sample dataset for reference. It is important to ensure that the data used is reliable, relevant, and supports the visualisation goals.
The competition encourages participants to utilise a variety of data visualisation techniques, including infographics, interactive dashboards, and dynamic charts. By employing creative and effective visualisation methods, participants can enhance the impact and engagement of their visualisations.
The DataFest VizQuest competition will run for one month, providing participants with ample time to ideate, collect data, and create their visualisations. The competition will culminate with a one-day in-person event to showcase and celebrate the participants’ work.
The submissions will go through a multi-phase evaluation process. In the Submission Phase, participants will be required to submit their visualisations along with a brief description of their ideas and techniques employed. Selected ideas will move to the Mentorship Phase, where assigned mentors will guide participants in the production of their final projects. In the Judging Phase, teams will pitch their visualisations to a panel and will be evaluated based on criteria such as creativity, feasibility, impact, technical proficiency, and presentation skills.
The top-performing visualisations will receive awards and recognition. The prizes include $1,000 for the 1st Place, $500 for the 2nd Place, and $300 for the 3rd Place. The winning visualisations will also be showcased during the main DataFest Africa event in Nairobi and featured on the Pollicy and DataFest Africa websites.
Both individuals and teams can participate in the competition. Participants can either enter as individuals or form teams of up to four or five members. The competition encourages collaboration and mixed-gender teams to bring diverse perspectives and expertise.
Participants are encouraged to bring their own concepts and data to the competition. They have the freedom to collect their own data that aligns with the themes or disregard the provided sample dataset. Original concepts should not be shared outside of the respective team to maintain fairness.
Participants can reach out to the organisers of VizQuest by contacting them via email at datafest2023@pollicy.org or through the telephone numbers +256 708310397 or +256 760193143. The organisers are available to address any queries, provide guidance, and offer support throughout the competition journey.